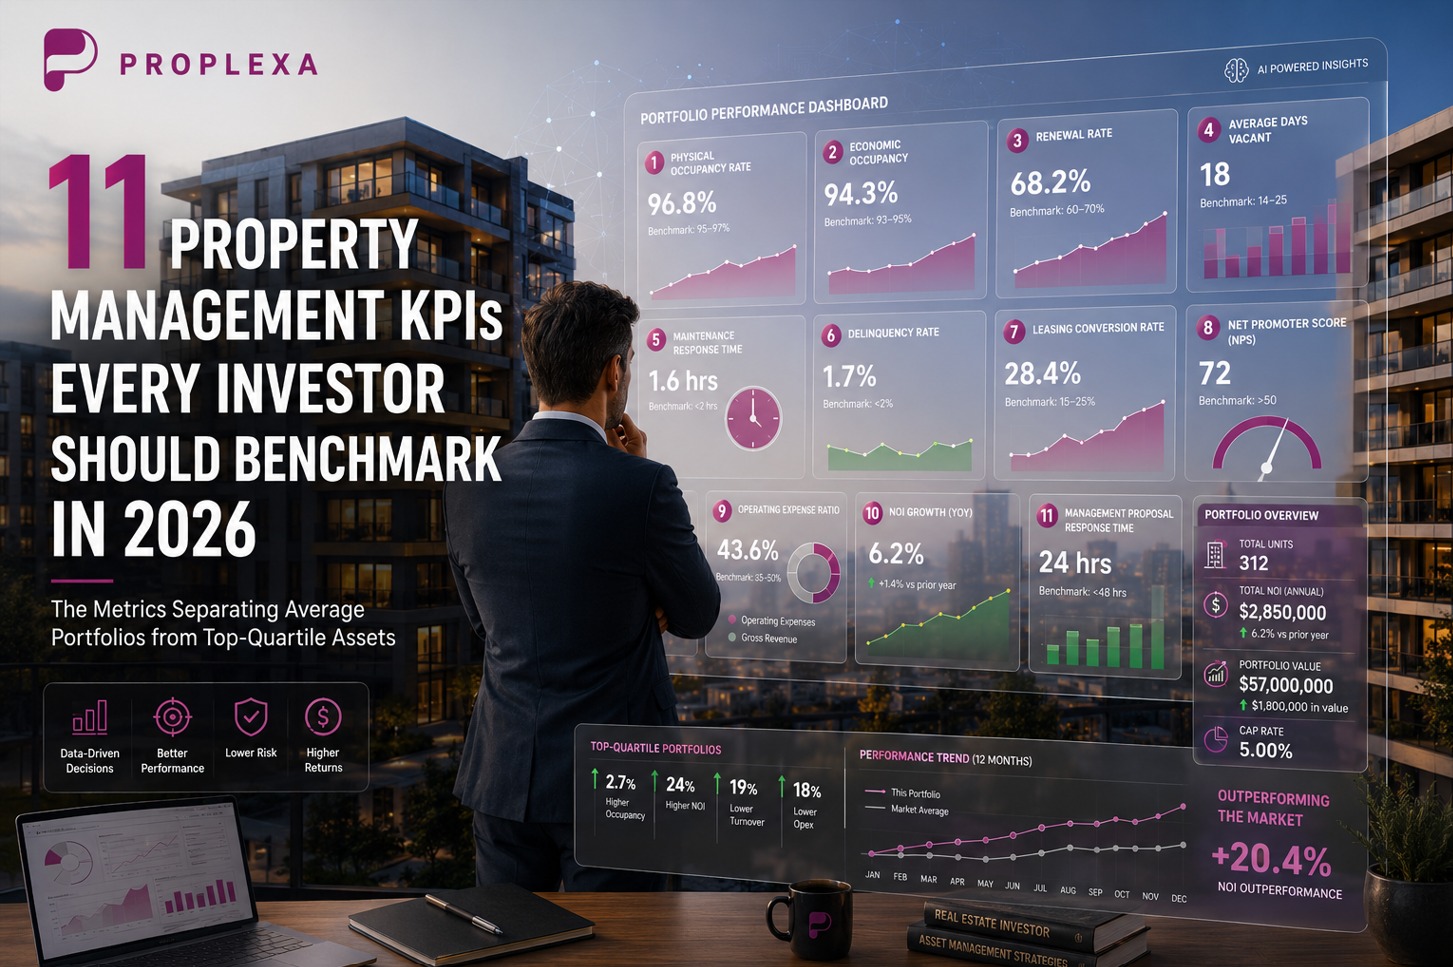
11 Property Management KPIs Every Investor Should Benchmark in 2026
Property management has traditionally been evaluated through subjective measures.
Is the manager responsive?
Do tenants seem happy?
Are maintenance requests being completed?
Those questions still matter.
But in 2026, institutional investors increasingly expect measurable performance.
The industry's most sophisticated owners now evaluate management companies much like private equity firms evaluate operating businesses.
Through data.
And increasingly, through standardized operational benchmarks.
1. Physical Occupancy Rate
This remains the foundation of portfolio performance.
Occupancy measures the percentage of leased units compared to total available inventory.
Typical benchmark ranges:
Performance Tier Occupancy
Excellent 97–99%
Strong 95–97%
Average 92–95%
Weak Under 92%
Occupancy directly influences:
● NOI
● Cap rate expansion
● Asset valuation
● Lender perception
Even a 2–3% improvement often produces six-figure revenue gains in midsized portfolios.
2. Economic Occupancy
Many investors overlook this metric.
Economic occupancy measures actual rent collected compared to potential rental income.
Formula:
Economic Occupancy = Collected Rent ÷ Gross Potential Rent
A property can report:
97% physical occupancy
while collecting only
93% economic occupancy.
The difference is usually caused by:
● Concessions
● Delinquencies
● Bad debt
● Lease loss
3. Renewal Rate
Resident retention is becoming one of the industry's most valuable KPIs.
Turnover costs can easily exceed:
$2,500–$7,500+
per apartment turnover depending on market.
Target benchmark:
Renewal Rate > 60%
Best-in-class operators:
70–75%+
Higher retention produces:
● More stable cash flow
● Lower marketing spend
● Reduced make-ready expenses
4. Average Days Vacant
Leasing velocity is often underestimated.
Benchmark:
Excellent:
< 14 days
Good:
15–25 days
Needs Improvement:
30 days
Every additional day vacant reduces annual NOI.
5. Maintenance Response Time
Residents increasingly expect hospitality-level service.
Benchmark:
Emergency requests:
< 2 hours
Standard requests:
< 24 hours
Leading operators now track:
Median completion time
instead of averages.
6. Delinquency Rate
Cash flow consistency matters.
Typical target:
Under 2%
Concerning:
Above 4%
Delinquency impacts:
DSCR
Financing
Refinancing potential
7. Leasing Conversion Rate
Measures:
Applications submitted
÷
Property inquiries
Benchmark:
15–25%
Strong operators often exceed:
30%
8. Net Promoter Score (NPS)
Resident satisfaction is increasingly quantified.
Benchmark:
NPS >50
Excellent:
70+
Higher NPS often correlates with:
Lower turnover
Higher renewals
Better online reputation
9. Operating Expense Ratio
Formula:
Operating Expenses ÷ Gross Revenue
Benchmark:
35–50%
depending on asset type.
10. NOI Growth
One of the most important institutional metrics.
Benchmark:
Annual NOI growth:
3–5%
Strong
5–8%
Excellent
8%+
Exceptional
Small operational gains can significantly influence asset values.
11. Management Proposal Response Time
This KPI is rarely discussed.
But increasingly important.
How long does a management company take to respond?
24 hours?
72 hours?
One week?
Response speed often predicts future operational performance.
Slow proposal processes frequently indicate slow operational execution.
Why Investors Should Demand KPI Transparency
Historically, selecting a property manager involved:
Referrals
Sales meetings
Phone calls
Google reviews
In 2026, investors increasingly expect:
Benchmarks
Comparisons
Performance reporting
Data visibility
The same way they evaluate:
Fund managers
Operators
Asset managers
Developers
Property management is becoming measurable.
The Future of Property Management Is Benchmarking
The industry's best operators don't simply say:
"We provide great service."
They demonstrate:
Occupancy trends
Renewal performance
Leasing velocity
Maintenance efficiency
Resident satisfaction
Portfolio growth
Data creates trust.
Trust creates better decisions.
How Proplexa Supports Better Decisions
At Proplexa, we believe property owners should evaluate management companies using objective criteria—not just marketing materials.
The future of management selection is likely to become increasingly data-driven.
Owners will compare:
Response times
Fees
Experience
Technology capabilities
Operational KPIs
And the firms that can prove performance will have a meaningful competitive advantage.